
Appearance
JavaScript errors
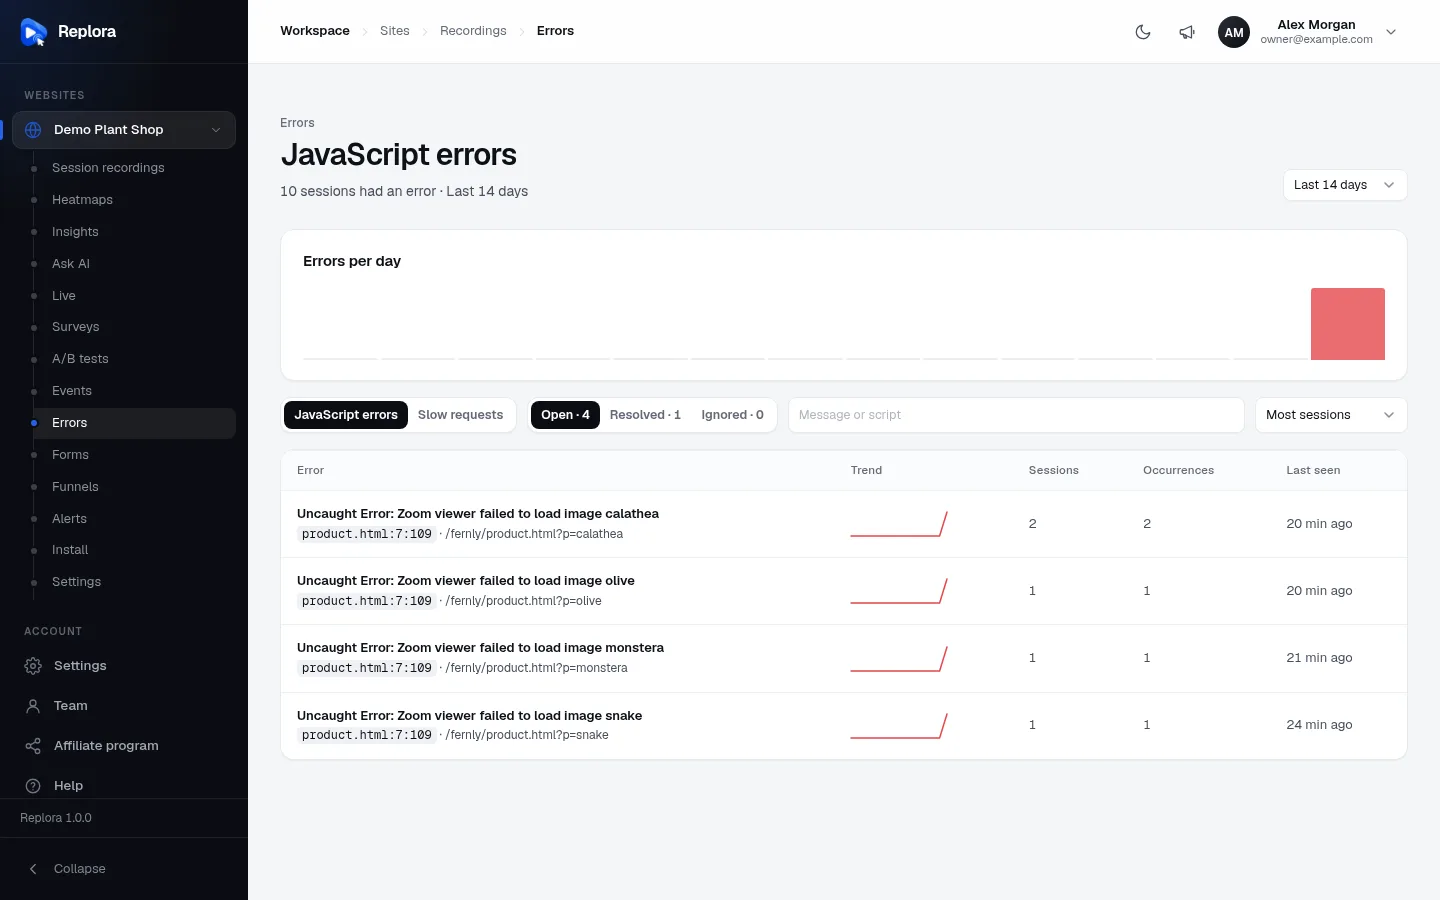
When something breaks in a visitor’s browser (a script error, a failed promise, a file that doesn’t load), the tracking code reports it. The Errors page groups those errors by cause, counts how many visits each one spoiled, and links to the replays, so you can see exactly what the visitor was doing when it happened. A second view lists the calls to your servers that are slow or fail.
Where to find it: in the sidebar, under your website, click Errors (for example Demo Plant Shop › Errors).
What is reported
The tracking code reports, by itself:
- uncaught JavaScript errors and unhandled promise rejections;
- files that failed to load (scripts, styles, images), as “Failed to load …”;
- what your site’s Content Security Policy blocked, and
console.errorcalls.
Nothing to set up. Each error is also marked on the timeline of its replay.
How errors are grouped
Errors with the same cause are one group, even when details differ:
- the message is compared with its changing parts (numbers, ids) left out, and without the browser’s “Uncaught” prefix;
- the script it came from is compared by path, without the query string and without build hashes in file names (
app.3f2a1b9c.jsandapp-77e01d4a.jsare the same file); - line numbers don’t matter, so a new release doesn’t split a known error into a new group.
The latest occurrence describes the group (message, file, line, stack).
The top of the page
| Part | What it does |
|---|---|
| Subtitle | “n sessions had an error · Last n days”. |
| Period (top right) | Last 24 hours, Last 7 days, Last 14 days (the default), Last 30 days, Last 90 days. |
| Errors per day | A bar per day of the period. Hover a bar for its date and count. |
| JavaScript errors / Slow requests | Switches between this view and Slow requests. |
| Open · n / Resolved · n / Ignored · n | Shows the groups with that status, with how many each status has. Open is the default. |
| Message or script | Search; press Enter to apply. |
| Order | Most sessions (the default), Most occurrences, Latest (last seen), Newest (first seen). |
The error list
| Column | Meaning |
|---|---|
| Error | The message. Under it, where it happened (file name with line and column, for example product.html:7:109, or Inline script) and the page. A Came back badge marks an error that was resolved and happened again. |
| Trend | A small line of the group’s occurrences per day in the period. |
| Sessions | Visits that had this error in the period. The best measure of how many people it affected. |
| Occurrences | How many times it happened in the period (one visit can hit it many times). |
| Last seen | How long ago it last happened. |
50 groups are shown per page, with a pager underneath. Your choices are kept in the page address.
An error’s details
Click an error to open its details:
| Part | What it shows |
|---|---|
| Title and description | The message; how many times and in how many sessions; when it was first and last seen. |
| Status notice | Resolved. It reopens by itself if it happens again., Ignored: it keeps being counted but stays out of the open list and the totals., or This error was resolved and came back …. |
| Last 30 days | The daily trend. |
| Where | The file with line and column (or Inline script), and the stack trace when the browser gave one. Useful for your developers. |
| Pages | The pages it happened on most (up to 5), with sessions. |
| Devices | Desktop, tablet, mobile (or Unknown), with sessions. |
| Sessions to watch | Up to 50 of the latest sessions that hit it, with how often (“once”, “n times”), the page and the device. Click a date to replay that visit at the moment of the error. |
Resolve, ignore or reopen
| Button | When | What it does |
|---|---|---|
| Resolve | Open errors | Marks it fixed. It moves to Resolved. If it happens again it reopens by itself, with a Came back badge, so you notice the fix didn’t work. |
| Ignore | Open errors | For errors you can’t or won’t fix (a browser extension, a third-party script). It keeps being counted but leaves the open list and the totals. |
| Reopen | Resolved or ignored errors | Puts it back in the open list. |
Managers and members can change the status; viewers can read everything but don’t see these buttons.
Slow requests
Switch to Slow requests to see every call your pages make to servers (fetch and XHR calls) grouped by address, with the slow and failed ones. The tracking code times these calls; it never records what they send or receive.
| Part | What it does |
|---|---|
| Subtitle | “slow of calls calls took 3 s or longer · period”. |
| Period | The same choices as for errors. |
| Address or server | Search; press Enter to apply. |
| Order | Most slow calls (the default), Slowest on average, Longest call, Most calls, Most failed. |
| Column | Meaning |
|---|---|
| Request | The method (GET, POST…) and the path, with the server under it. Changing parts of addresses, such as ids, are shown as :id, so /orders/42 and /orders/43 are one row. |
| Calls | How many calls were made. |
| Average / Longest | Average and longest duration. |
| Slow | The share of calls that took the “slow” time or longer; red from 10%. |
| Failed | The share of calls that failed: no answer, or an error status (400 or higher). |
| Sessions | Visits with at least one slow or failed call to it. |
Click a row to see an example address, the totals, and Sessions to watch: up to 50 sessions with slow calls (“slow n times · longest t”), each replayed from its first slow call.
How long is “slow”? By default 3 seconds. The administrator of your Replora installation can change it (in the Replora Docs: Installation settings); it applies to calls recorded from then on.
Tips
- Sort by Most sessions. An error that hits one visitor 500 times matters less than one that hits 500 visitors once.
- Watch before you fix. The replay shows what the visitor clicked just before the error, which is often the missing piece for your developers.
- Resolve after each release. If an error comes back, you see it at once.
- Get an email or Slack message the moment a new error appears: create an alert for A JavaScript error or A failed request.
Who can use it
Everyone with access to the website can read errors and slow requests; managers and members can resolve, ignore and reopen. In the SaaS edition error tracking must be included in your plan.
Related
- Alerts
- Watching a replay: the Console and Network tabs of a replay.
- Behavior insights: errors count towards the frustration rate.
- Ask AI: “Which JavaScript errors affect the most sessions?”