
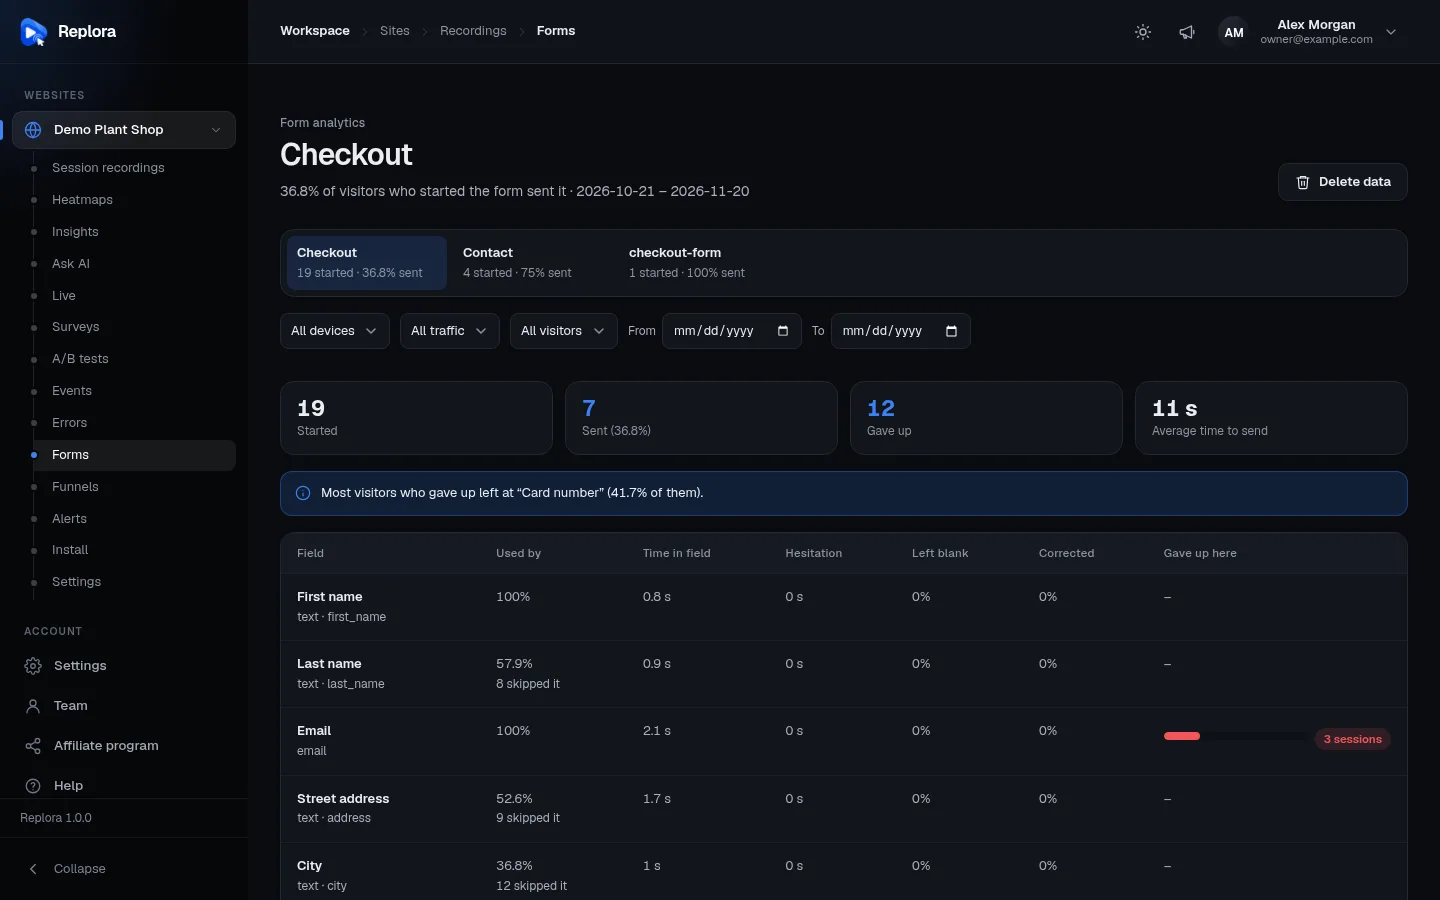
Appearance
Form analytics
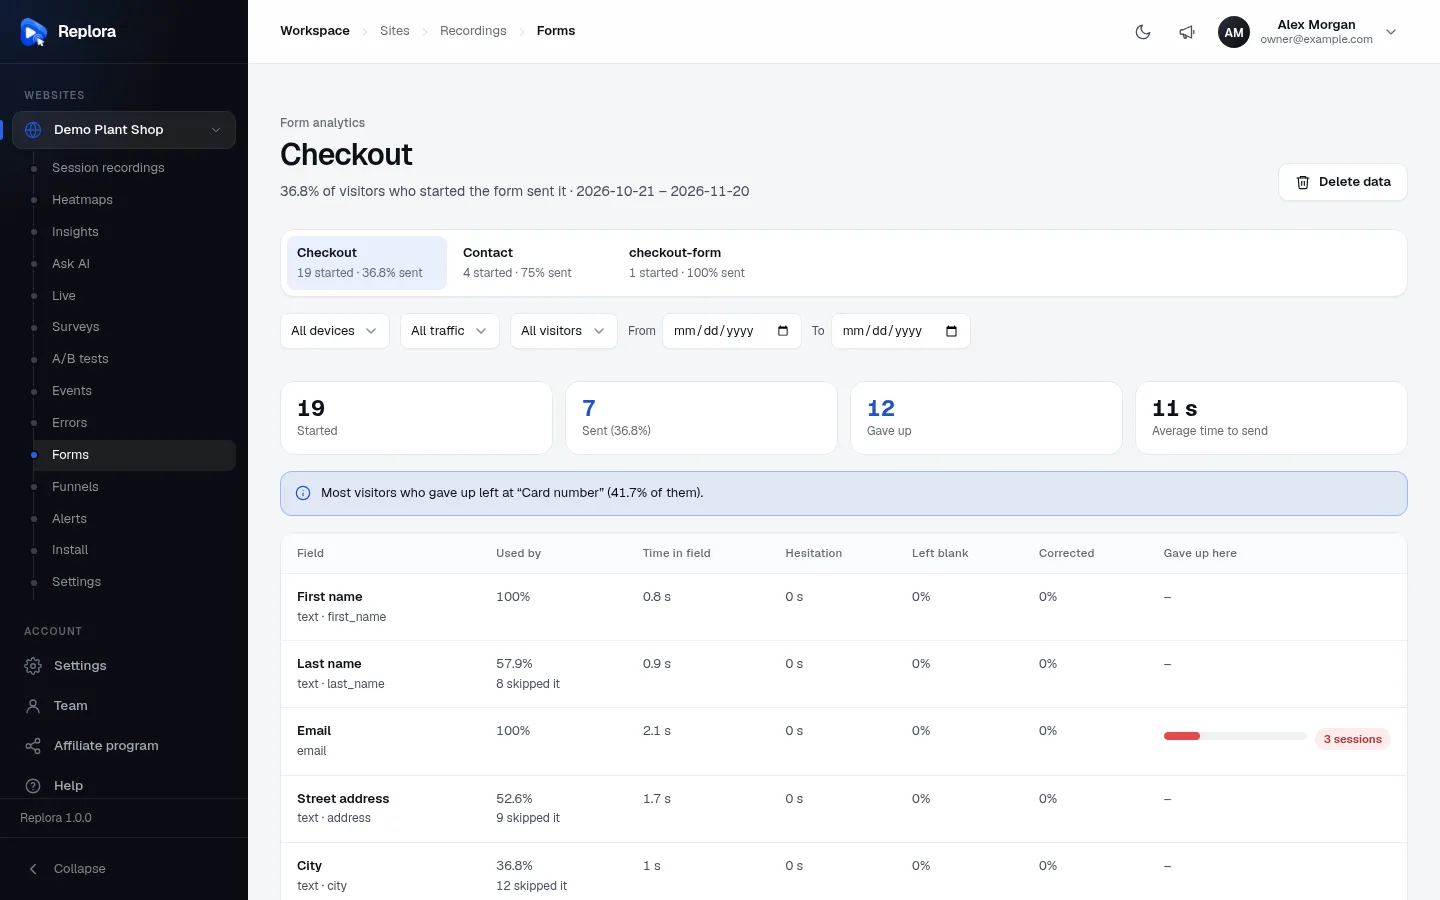
Form analytics shows how visitors fill in each of your forms: how many start it, how many send it, how long each field takes, which fields make them hesitate, which ones they leave blank or correct, and at which field those who give up leave. It never records what visitors type, only how they use the fields.
Where to find it: in the sidebar, under your website, click Forms (for example Demo Plant Shop › Forms).
Which forms appear
Forms appear by themselves the first time a visitor uses them. Nothing to set up:
- every HTML
<form>on your pages is tracked; - forms built without a
<form>element (for example in some page builders or single-page apps) appear once your developer marks them withdata-sr-form="Name"; - a form that a script sends without a normal submit counts as sent when the site calls
__sr.push(['formSubmitted'])(see the JavaScript API).
A form is named after its data-sr-form name, or else its label, name or id as the page gives them. Fields are named after their label as the page shows it (or their placeholder or name). Fields inside parts of the page that are blocked from recording are not tracked at all.
The forms list
The list on the left (or along the top on narrower screens) shows every form used in the period, most used first:
| Item | Meaning |
|---|---|
| Name | The form’s name, as above. |
| “n started · n% sent” | Sessions that started the form (focused one of its fields) and the share of them that sent it. |
Click a form to see its report. The first form is selected when you open the page.
The report
Filters
| Filter | Choices |
|---|---|
| Device | All devices, Desktop, Tablet, Mobile |
| Traffic | All traffic, Direct, Search, Social, Email, Paid, Referral |
| Visitors | All visitors, New, Returning |
| From / To | Any dates (the end can’t be before the start). Empty: the last 30 days. |
Totals
| Total | Meaning |
|---|---|
| Started | Sessions that focused at least one field of the form. |
| Sent (n%) | Sessions that sent it, and the conversion: sent ÷ started. Click the number to list those sessions. |
| Gave up | Sessions that started but didn’t send it. Click the number to list them. |
| Average time to send | Average time from the first field to sending. “–” when nobody sent it. |
The subtitle repeats the conversion: “n% of visitors who started the form sent it · from – to”.
Hints
Blue notices point out what to look at first:
- Most visitors who gave up left at “field” (n% of them). Shown when one field clearly leads.
- Visitors hesitate unusually long before filling in “field”. A clearer label or a hint may help. A field is “slow” when visitors wait at least twice as long as the form’s typical field, and at least 3 seconds, before typing (fields used in 5 sessions or more).
- Hardly anyone uses “field”. Consider removing them: shorter forms get finished more often. Fields clicked into by fewer than 5% of the visitors who started the form, once at least 20 did.
The field table
One row per field, in the form’s order (fields the page no longer has come last).
| Column | Meaning |
|---|---|
| Field | The field’s label, and in small print its type (text, email, select…) and its technical name. |
| Used by | The share of sessions that started the form and clicked into this field. “n skipped it” counts the ones that didn’t. A Hardly used badge marks fields almost nobody uses. |
| Time in field | Average total time a visitor spends in the field. |
| Hesitation | Average time between clicking into the field and the first keystroke. A Slow badge marks fields where visitors wait unusually long. |
| Left blank | The share of visitors who were in the field but left it empty. |
| Corrected | The share who came back to the field after leaving it, usually to fix what they entered. |
| Gave up here | Of the sessions that gave up, how many left at this field (the last field they used), with a bar. Click to list those sessions. |
“–” means nobody used the field in the period.
Sessions behind a number
Clicking Sent, Gave up or a Gave up here count lists up to 50 of the latest matching sessions under the table, with “Sent” or “Last field: name” for each. Click a date to replay that visit from the moment the form was used.
Delete a form’s data
Delete data (top right) asks “Delete this form’s data?”. Everything measured on this form is deleted; recordings stay. The form comes back in the list when visitors use it again. Useful after you redesign a form, to start measuring from zero. Managers and members can delete data; viewers can’t.
Privacy
Replora never sends what visitors type into fields to its servers for form analytics: only times, whether a field is empty or not, whether it was changed, and how often it was visited. Field labels that are masked on the page are not sent either.
Tips
- Fix the “Gave up here” leader first. It is where you lose the most people.
- High “Corrected” on a field often means unclear format rules (phone numbers, dates, postcodes). Show an example or accept more formats.
- Long hesitation on fields like phone number or date of birth usually means visitors wonder why you need it. Say why, or make it optional.
- Watch some visits of people who gave up at a field before changing it.
- Use Funnels with a Typed in a field step to follow forms across several pages.
Who can use it
Everyone with access to the website can read the reports. In the SaaS edition form analytics must be included in your plan.
Related
- Funnels
- Watching a replay
- Website settings: privacy and masking.
- Behavior insights