
Appearance
Heatmaps
A heatmap shows, on top of a real picture of your page, where visitors click, where they move the mouse, how far down they scroll and which parts stay on screen longest. Warm colours mean “a lot”, cool colours mean “a little”. You don’t set anything up: as soon as the tracking code records visits, every page gets its heatmaps.
Where to find it: in the sidebar, under your website, click Heatmaps (for example Demo Plant Shop › Heatmaps). The Heatmaps button above the session list leads to the same page.
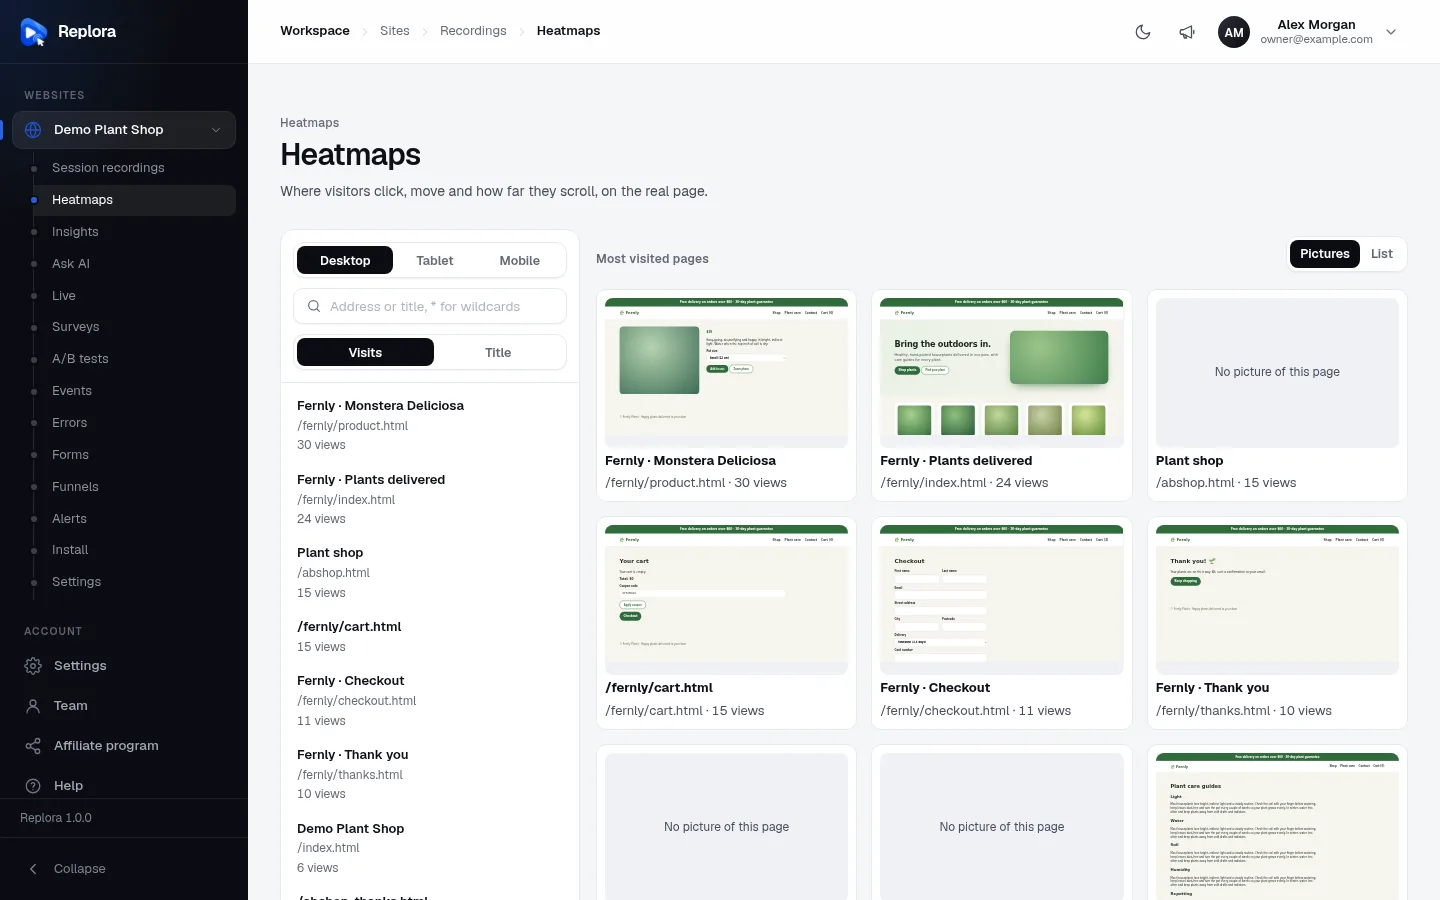
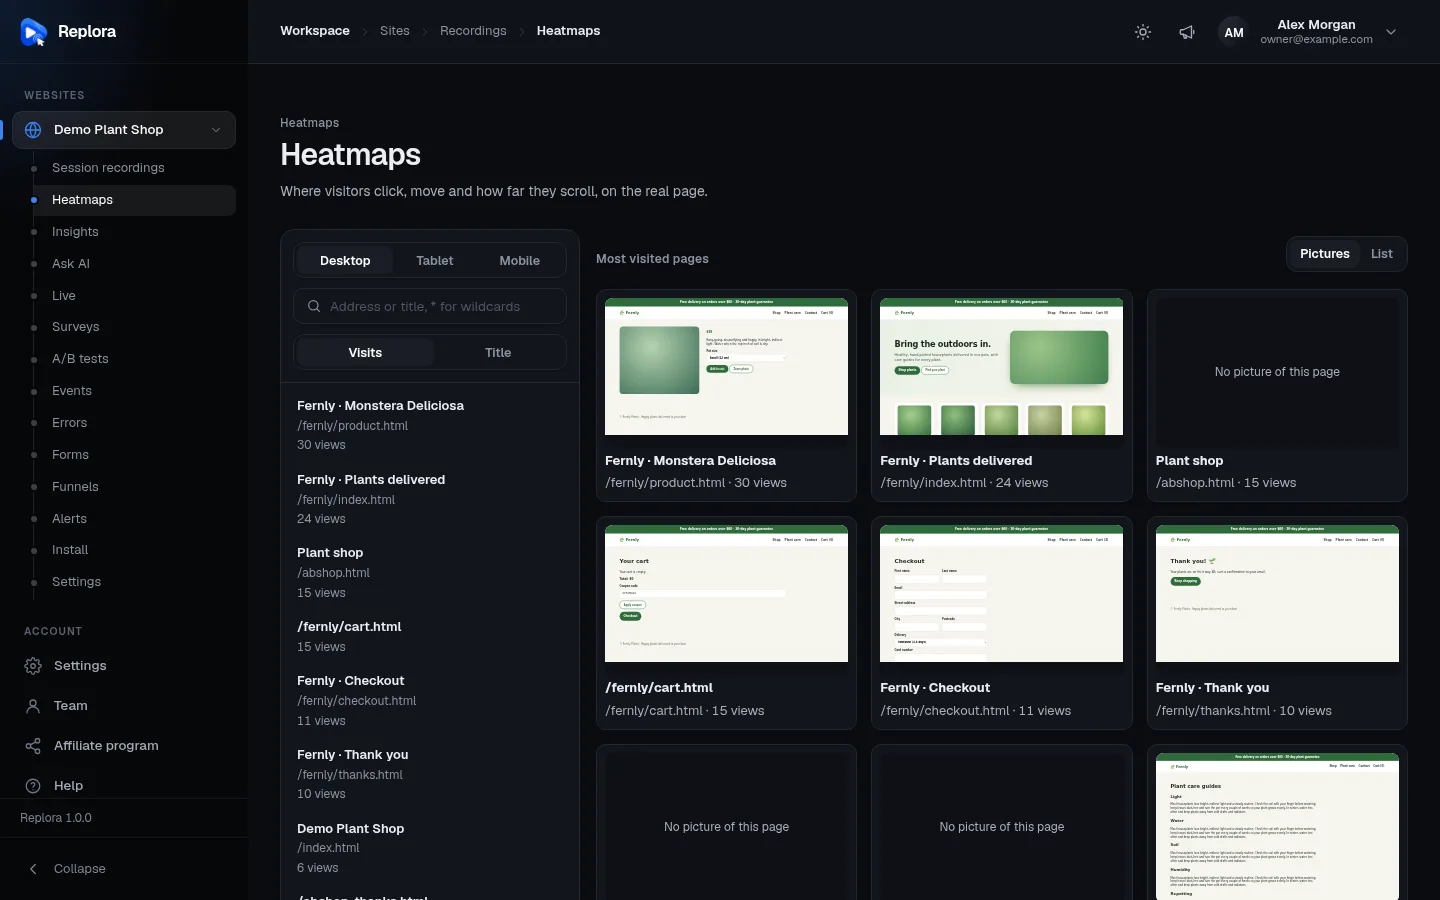
1. DeviceDesktop, Tablet or Mobile. Each device has its own heatmaps, because the same page is laid out differently on each.
What each heatmap shows
Replora has four kinds of heatmap. Pick one with the switch above the page once a page is open.
| Heatmap | What it shows | How to read it |
|---|---|---|
| Clicks | Every click and tap, placed on the element that was clicked. | Hot spots are where people click most. A hot spot on something that isn’t a link or button means visitors expect it to do something. Rage clicks are counted separately (see below). |
| Movement | Where the mouse pointer travels and rests (desktop). | Most people look where their mouse is. Warm areas got attention; cold areas were mostly ignored. Movement is counted in a coarse grid in the visitor’s browser, never as a recording of each mouse position. |
| Scroll | How many page views reached each part of the page. | The page is cut into twenty bands of 5 %. Each band is labelled “n% reached this point”. A purple line marks the median depth (half the visitors scrolled further), a blue line the average depth. |
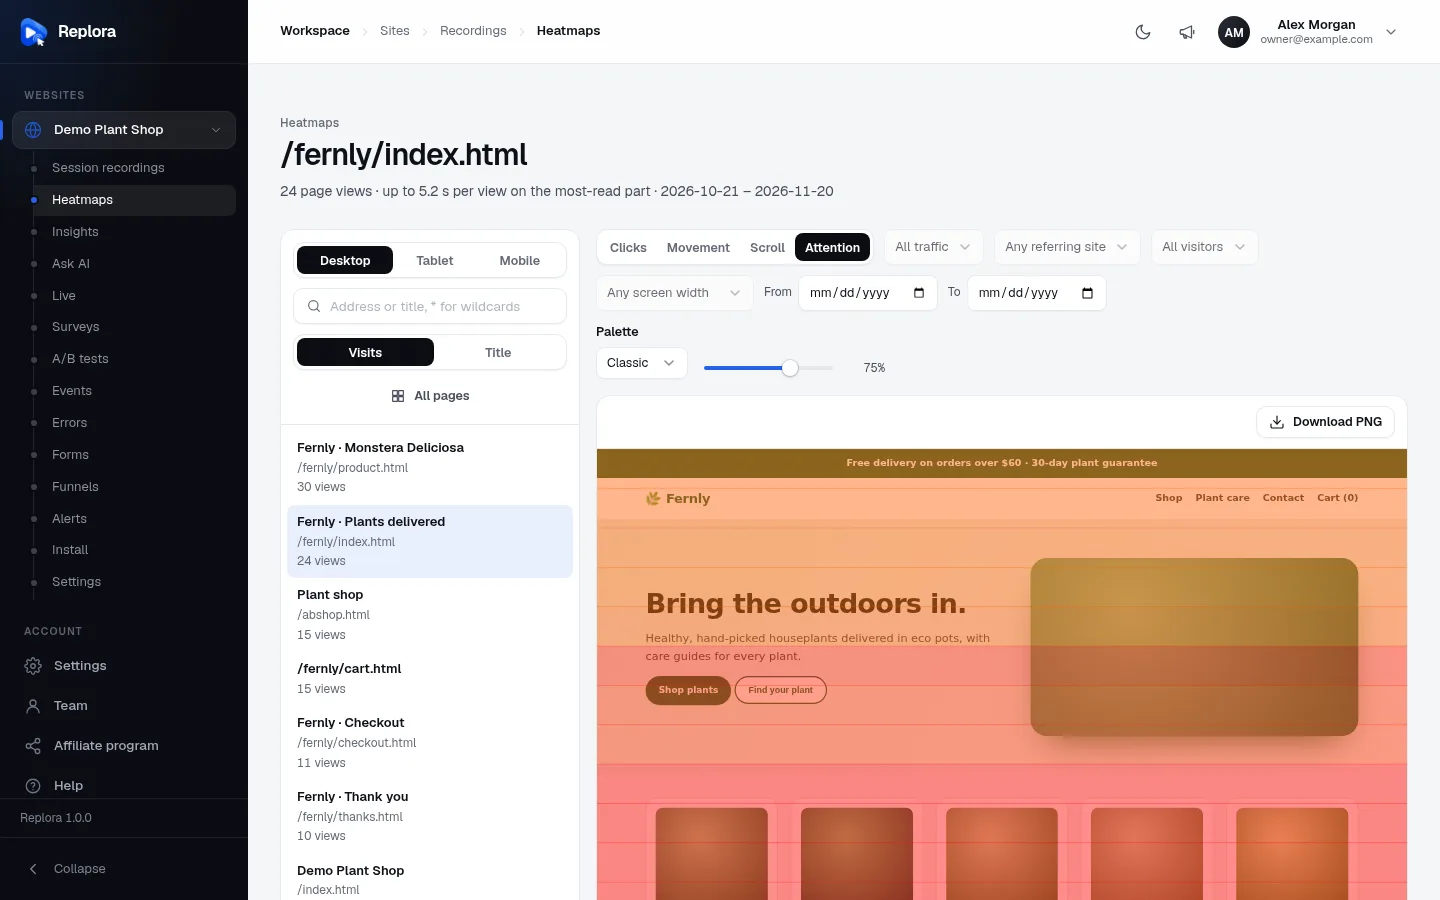
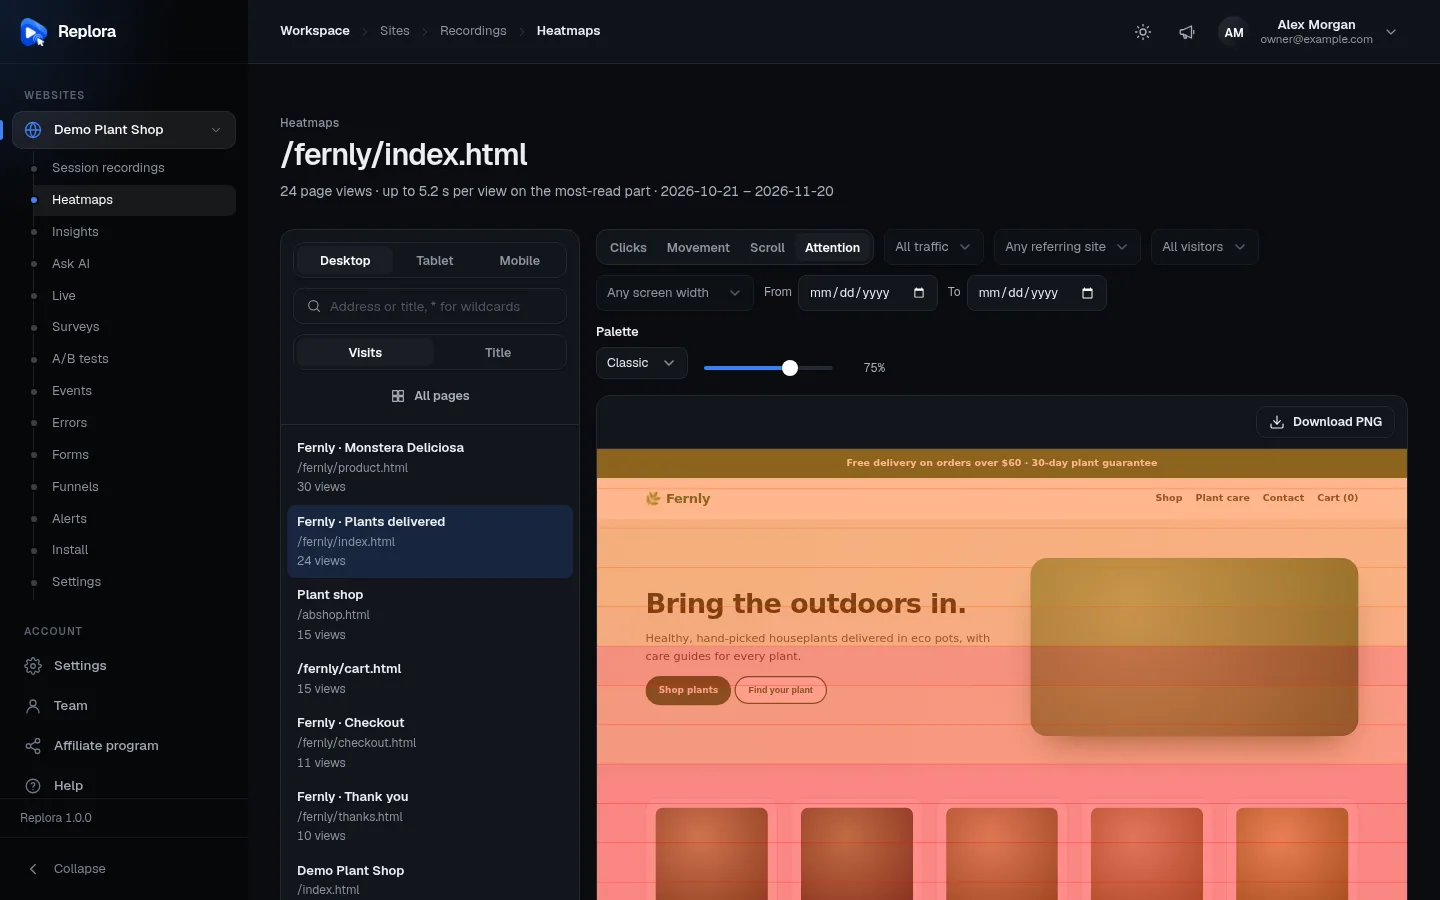
| Attention | How long each part of the page was actually on screen. | Hover the page to read “n s on screen per visit” for a band. The parts read longest are the warmest. |
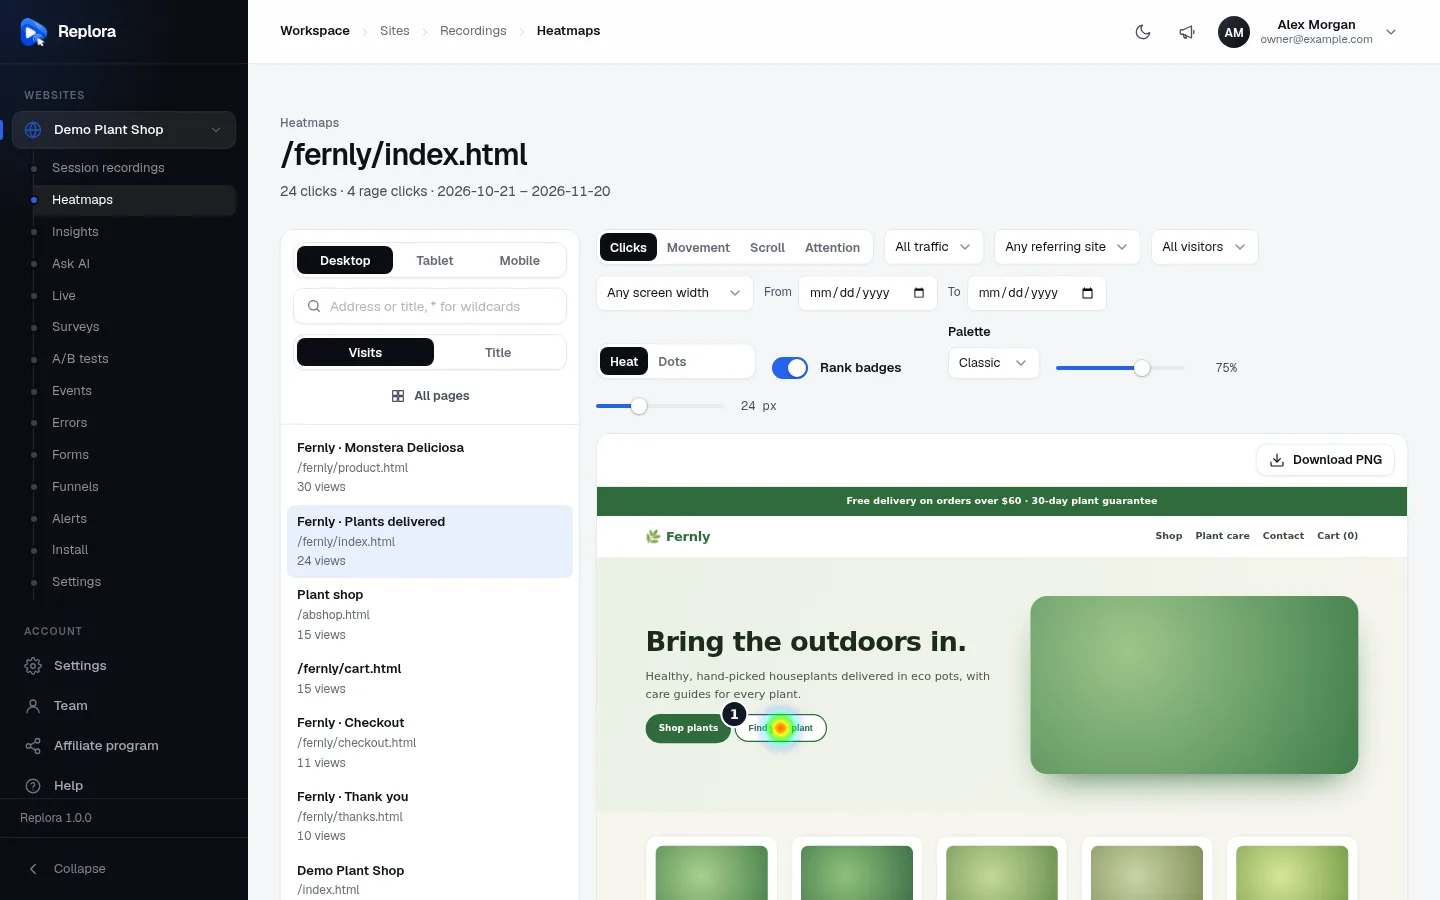
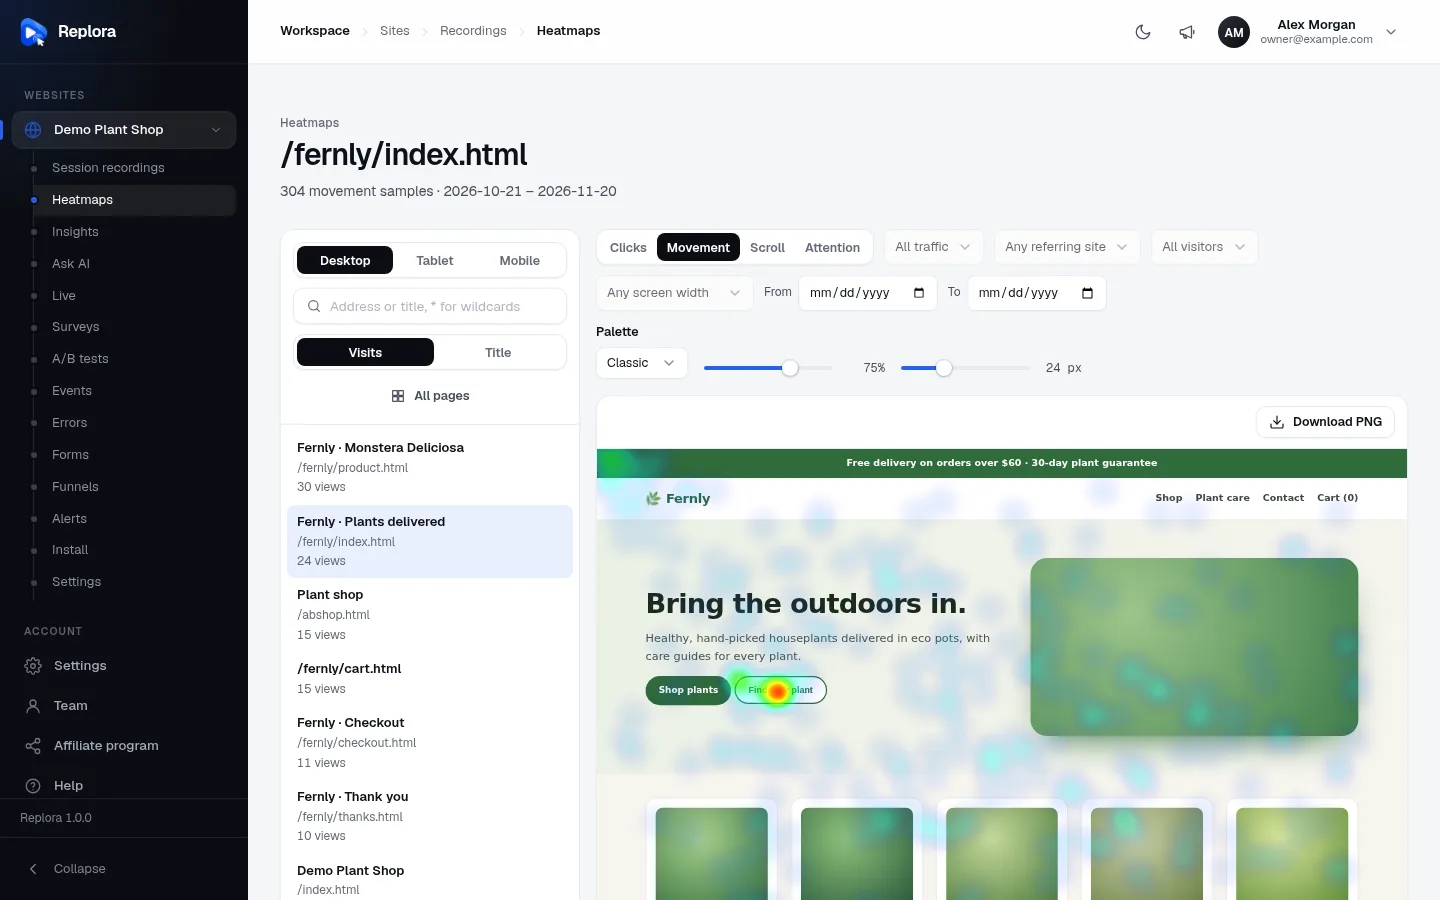
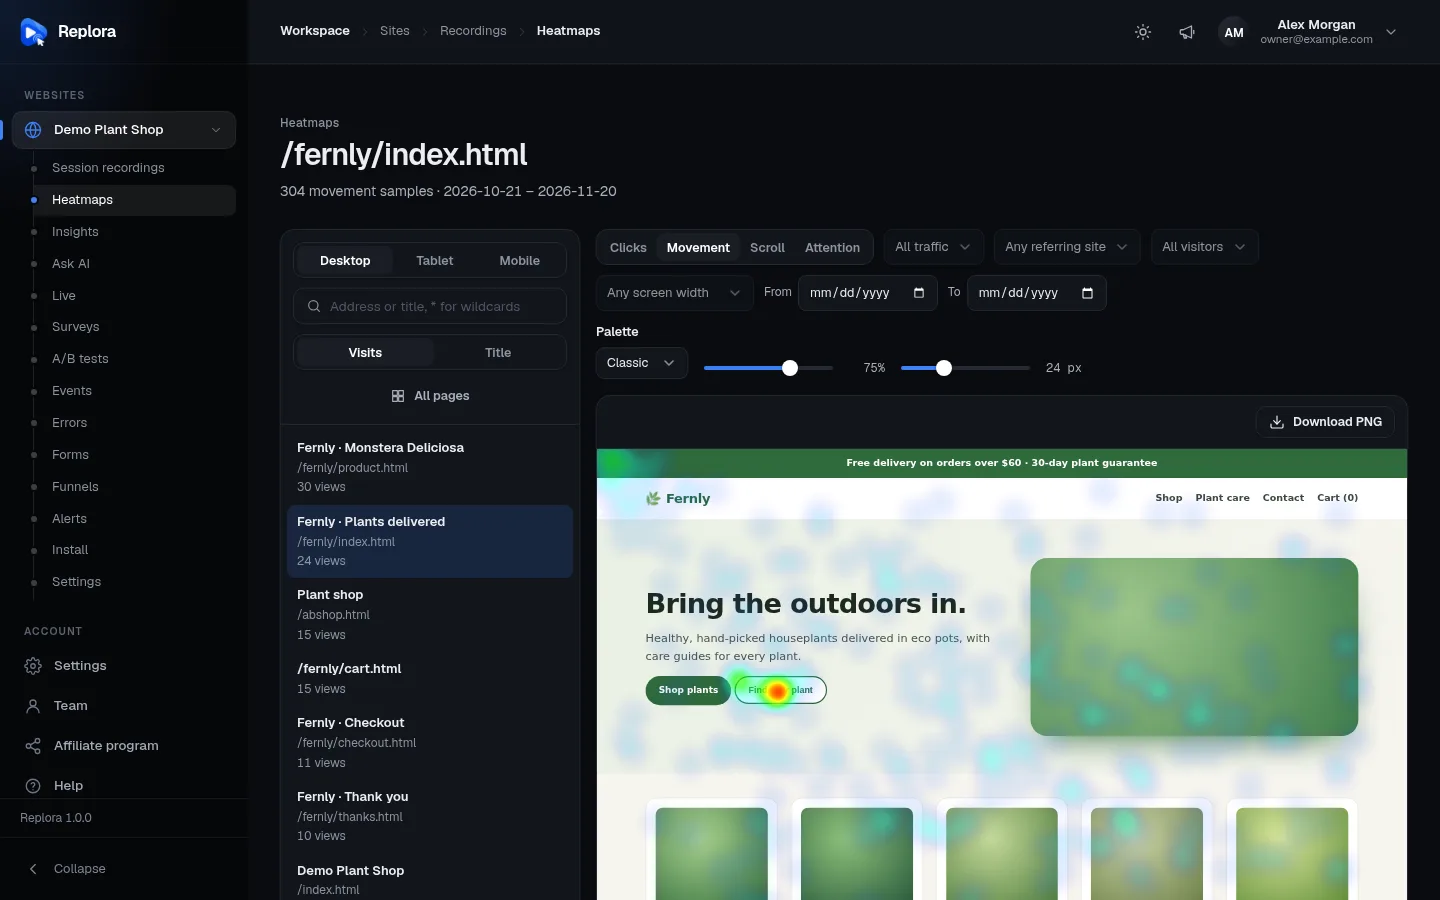
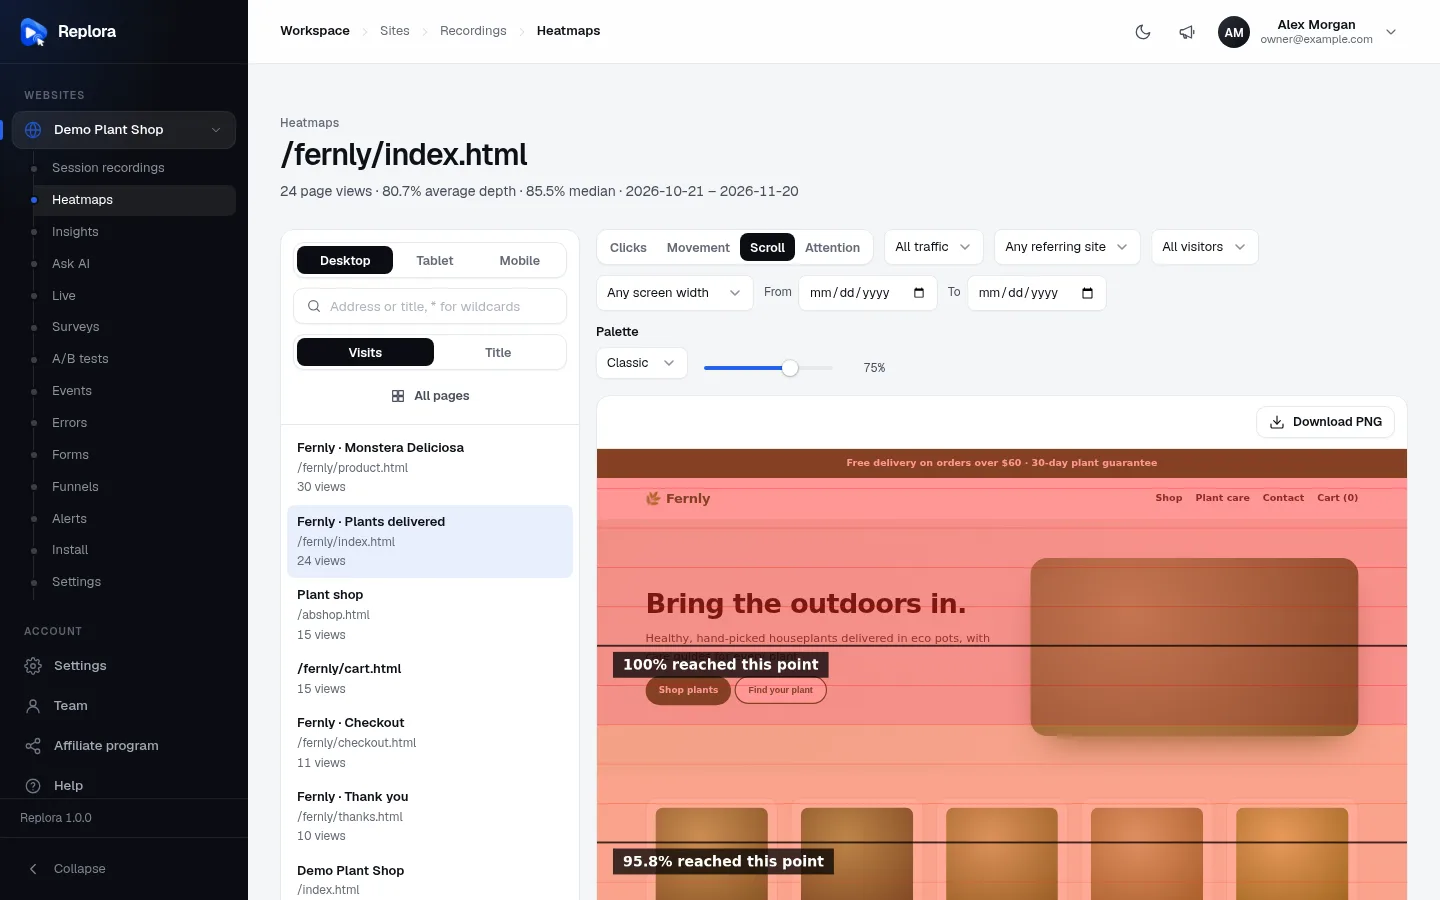
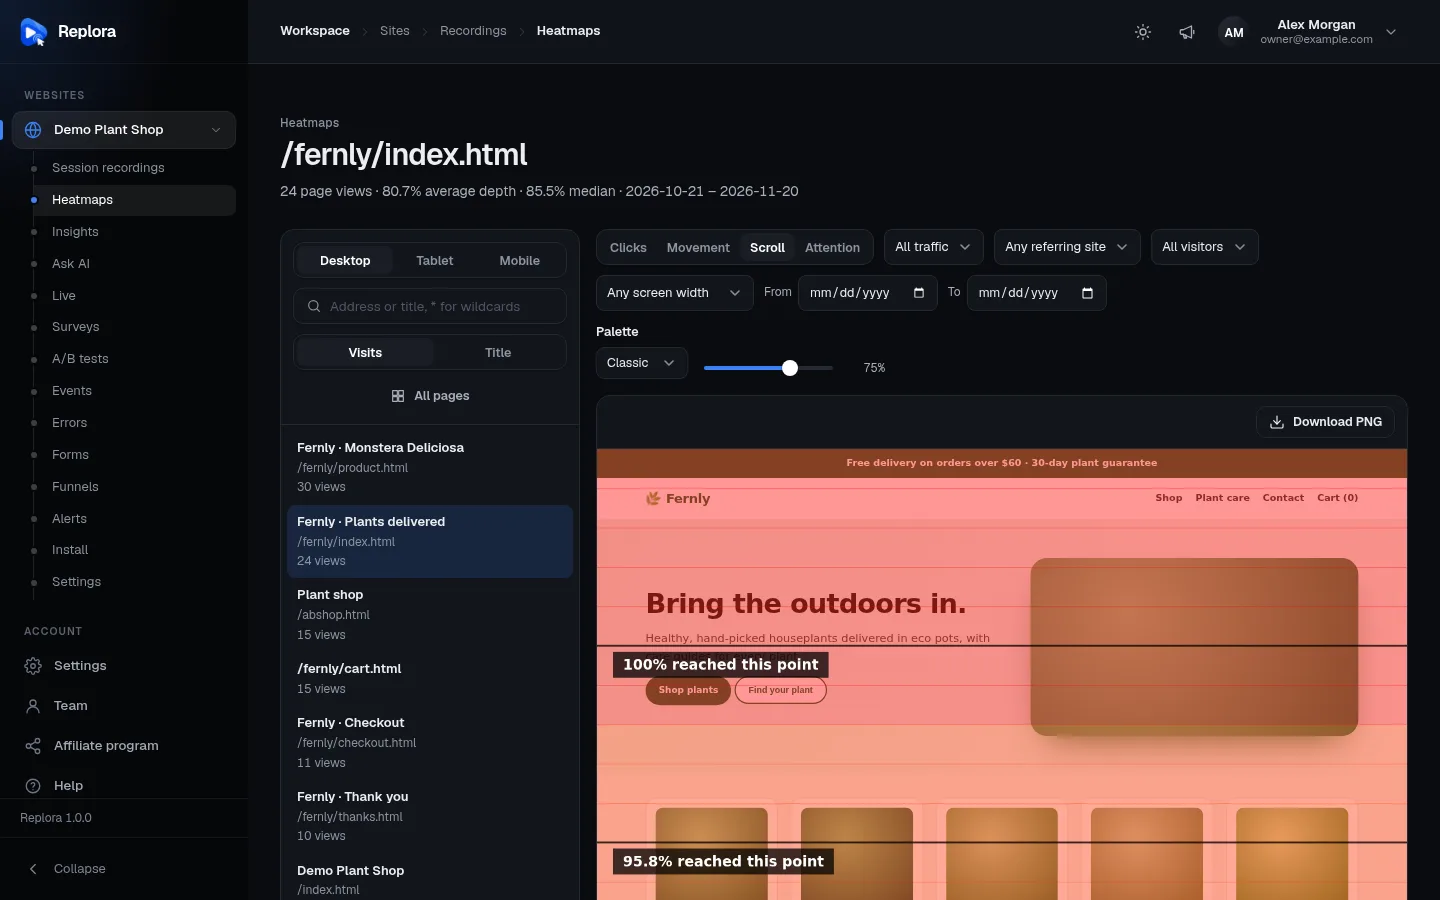
The summary under the page title changes with the heatmap:
- Clicks: “n clicks · r rage clicks”.
- Movement: “n movement samples”.
- Scroll: “n page views · avg% average depth · median% median”.
- Attention: “n page views · up to s s per view on the most-read part”.
Each is followed by the period shown, for example 2026-10-21 – 2026-11-20.
Rage clicks and dead clicks
A rage click is the third click within one second inside a small area: someone hammering something that doesn’t respond. A dead click is a click on something that looks clickable after which nothing happens on the page for a second. Both are strong signs of frustration; Behavior insights lists the worst ones for you.
Open a page’s heatmap
- Open Heatmaps for your website.
- Pick the device: Desktop (the default), Tablet or Mobile.
- Click a page in the list on the left, or a thumbnail under Most visited pages.
- Can’t find it? Type in Address or title, * for wildcards, or enter any address in Or enter any page address… under the thumbnails and click View heatmap. You may leave out
https://: Replora adds the scheme your pages use.
- Can’t find it? Type in Address or title, * for wildcards, or enter any address in Or enter any page address… under the thumbnails and click View heatmap. You may leave out
- The page is drawn from a real recording and the heat appears on top. Choose Clicks, Movement, Scroll or Attention.
- To go back to all pages, click All pages under the page list.
Everything you choose (page, heatmap, device, filters) is kept in the page address, so you can bookmark a heatmap or send its link to a colleague who has access to the website.
The page list
| Control | What it does |
|---|---|
| Desktop / Tablet / Mobile | Shows the pages and heatmaps of that device. Changing the device closes the open page. |
| Address or title, * for wildcards | Filters the list by address or title (any case). * stands for anything: /blog/* finds every blog post. |
| Visits / Title | Orders the list by number of views (most first) or alphabetically by title (pages without a title by address). |
| A page | Shows the page title (or its address), the address and “n views”. “no snapshot yet” means heat exists but no recording can draw the page yet. |
| All pages | Shown while a page is open: back to the overview. |
| Pictures / List | (Overview) thumbnails or a compact list of the most visited pages. |
| Or enter any page address… + View heatmap | Opens the heatmap of any address, even one that isn’t in the list. |
The list holds up to the 200 most viewed pages of each device. Long lists are shown a page at a time, with a pager underneath.
Why does a page have no picture?
Heatmaps are drawn on a snapshot of the page taken from a recording. If a page was only seen in visits without a full snapshot (for example very short visits), the page shows “No recording of this page can draw it yet. Heat appears once a visit with a full page snapshot arrives.” Visit the page once yourself with the tracking code installed and it will appear.
Filters
The filter row appears above the page once a page is open.
| Filter | Choices | Applies to |
|---|---|---|
| Heatmap | Clicks, Movement, Scroll, Attention | |
| Traffic | All traffic, Direct, Search, Social, Email, Paid, Referral | Clicks and Scroll |
| Referring site | Any referring site, or one of the (up to 20) domains this page’s visitors came from in the period, each with its number of views. Subdomains count too: news.example.com is included in example.com. | Clicks and Scroll |
| Visitors | All visitors, New, Returning | Clicks and Scroll |
| Screen width | Any screen width, Under 768 px, 768–1023 px, 1024–1439 px, 1440 px and wider | Clicks and Scroll |
| From / To | Any dates. Empty: the last 30 days. | All heatmaps |
Movement and Attention heatmaps are not split by segment: for them the Traffic, Referring site, Visitors and Screen width filters are greyed out, and only the device and the dates apply.
Display options
These change only how the heat is drawn, not the numbers.
| Option | Shown for | What it does | Default |
|---|---|---|---|
| Show clicks as: Heat / Dots | Clicks | Heat blends clicks into a glowing cloud; Dots draws each click spot as a dot, easier to read on small elements. | Heat |
| Rank badges | Clicks | Numbered badges (1, 2, 3…) on the most clicked elements, matching the ranking table below the page. | On |
| Palette | All | The colour scale: Classic (blue → green → yellow → red), Thermal (black → purple → orange → pale yellow), Viridis (purple → green → yellow) and Plasma (blue → pink → yellow). Viridis and Plasma stay readable for people with colour blindness. | Classic |
| Opacity | All | How strongly the heat covers the page, from 0.2 to 1. | 0.75 |
| Radius | Clicks (Heat) and Movement | How big each point of heat is, from 8 px to 60 px. Bigger blends more; smaller shows precise spots. | 24 px |
How to read the colours
With the Classic palette: red is the hottest (most clicks, most movement, most time), then yellow, green, cyan, and blue the coolest. Areas with no colour got no activity at all. Colours are relative to the busiest spot of this heatmap, so a red spot on a quiet page may be a handful of clicks: check the numbers in the summary and in Most clicked elements.
In the Scroll heatmap the colour shows the share of page views that reached that band: warm at the top where everyone is, cooling as visitors give up.
Most clicked elements
Under a Clicks heatmap, a table ranks the clicked elements (the top 50 shown, out of up to 200 measured).
| Column | Meaning |
|---|---|
| # | The element’s rank: the same number as its badge on the page. |
| Element | The element’s text (or “(no text)”) and, in small print, how Replora finds it on the page. |
| Clicks | Clicks on this element in the period and segment. |
| Share | Its part of all clicks on the page, with a bar. |
| Rage | Rage clicks on it, in red; “—” when none. |
Click a column heading to sort by it (click again to reverse). Click a row to outline the element on the page; click it again to clear the outline.
If a warning says “n clicks are on elements this version of the page no longer has”, the page changed since those clicks: they still count in the totals but can’t be placed.
Download a heatmap as a picture
Click Download PNG above the page. You get an image of the whole page with its heat, and a header with Replora, the heatmap type, the address, the period, the segment (for example Search, New) and the numbers. Handy for reports and slides. If the page is still being drawn, you are asked to wait a moment.
How pages are grouped (URL grouping)
Heatmaps add up all views of the same page. Replora decides what “the same page” is from the address:
- the query string and the part after # are ignored:
/product?ref=adand/productare one page; - the host name is compared in lower case, and a trailing slash is ignored (except for the home page
/).
Some sites have many addresses for what is really one layout, such as /product/monstera, /product/calathea, /product/olive. To see them together in one heatmap, your developer can tell the tracking code which page group a page belongs to with the pageUrl command, for example:
js
window.__sr = window.__sr || [];
__sr.push(['pageUrl', 'https://shop.example.com/product/*']);
Every product page then counts as one page, /product/*, in heatmaps (and in funnels). The address is only a name for the group: it doesn’t have to exist. See the JavaScript API in the Replora Docs.
Grouped pages must look alike
Only group pages that share a layout. Clicks are placed on the element that was clicked (the “Add to cart” button, the gallery…), so grouped pages need the same elements to show meaningful heat.
Tips
- Compare devices. Mobile visitors often scroll much further and tap different things. Look at each device separately.
- Check the fold. In the Scroll heatmap, if the median line sits above your main call to action, half of your visitors never see it.
- Look for clicks on non-links. Heat on images, headings or prices that aren’t clickable shows what visitors expect to be a link.
- Segment by traffic. Paid visitors may behave very differently from search visitors on the same landing page.
- Watch the people behind the heat. Heatmaps tell you where; recordings tell you why. Use Session recordings filtered by the visited page to watch some visits.
Who can use heatmaps
Everyone with access to the website, including viewers, can open heatmaps. In the SaaS edition heatmaps must be included in your plan (see Plan & billing).
Related
- Behavior insights: the pages and elements that frustrate visitors most, with a link to each page’s heatmap.
- Funnels: where visitors drop out on the way to a goal.
- Filters & search: find the recordings behind what you see.
- Watching a replay