Appearance
Dashboard tour
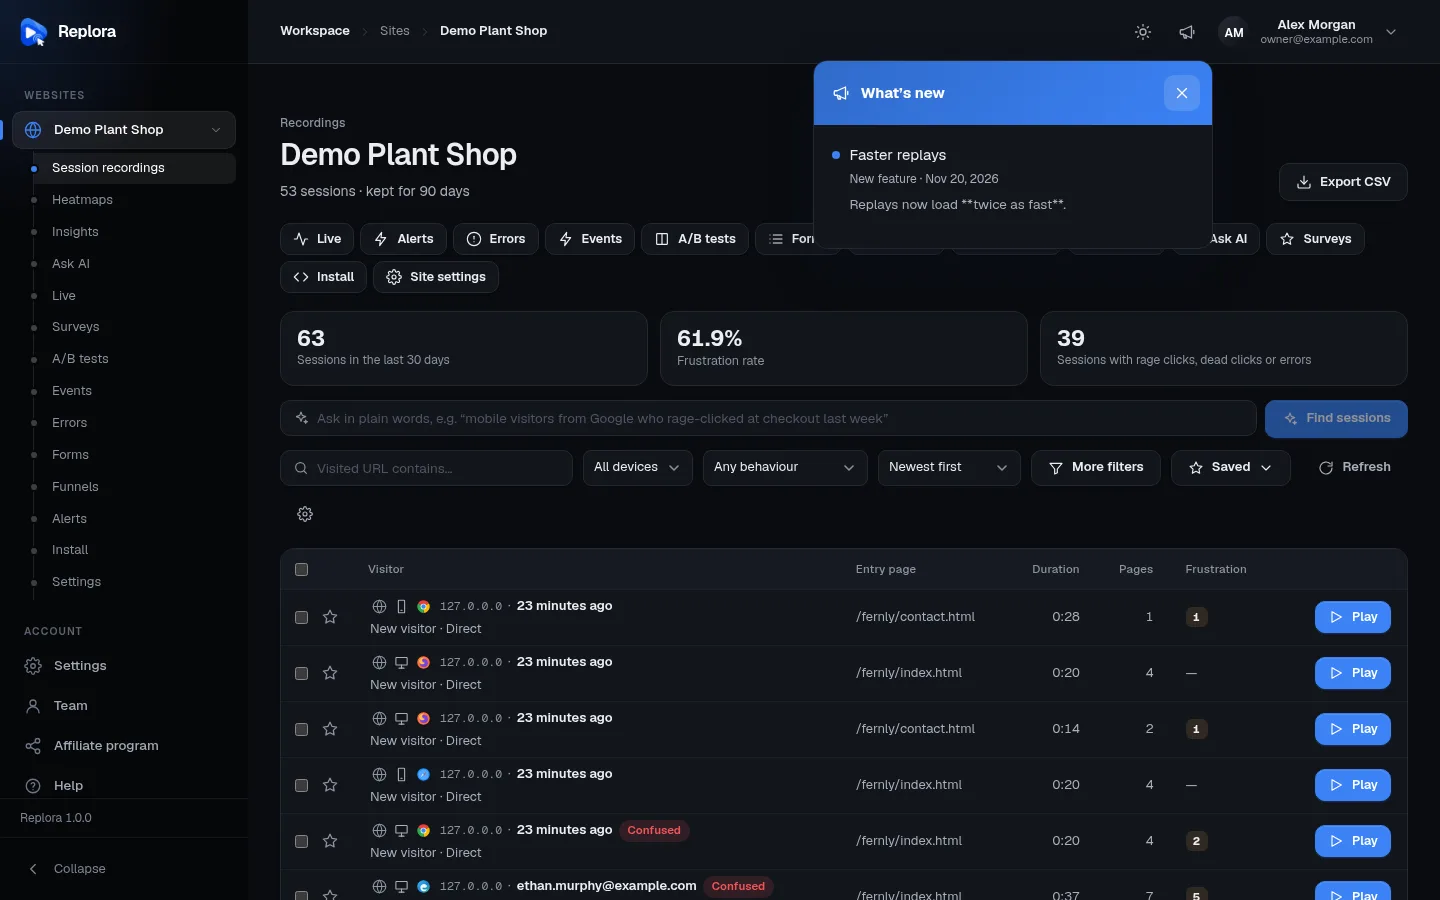
After signing in you land in the dashboard: a dark sidebar with your websites on the left, a top bar with where you are and your account, and the page in the middle. Every website has the same set of pages (recordings, heatmaps, funnels…), so once you know one, you know them all.
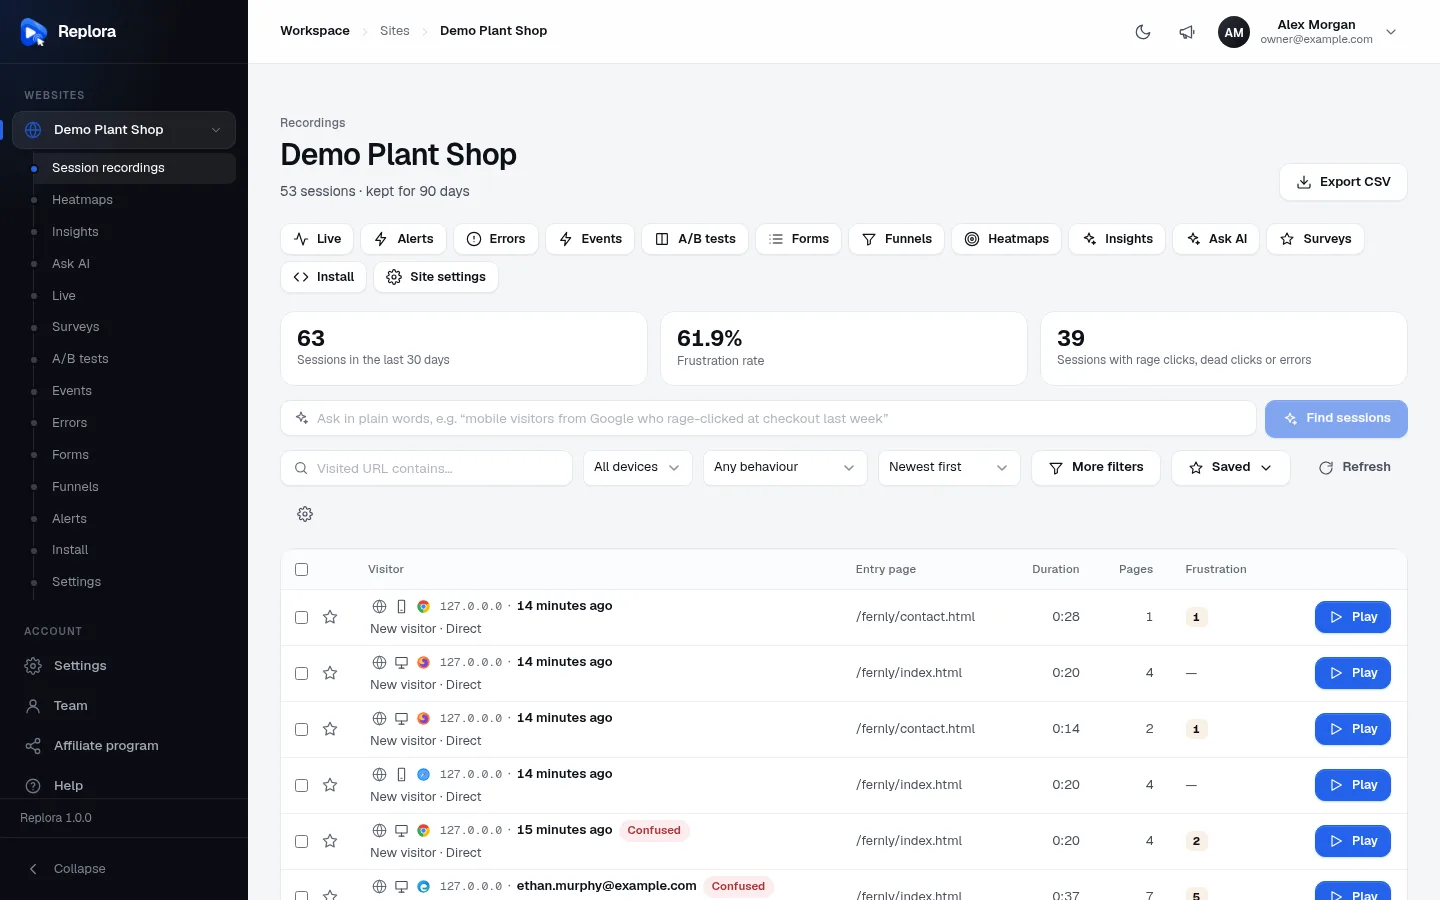
1. WebsitesThe heading opens the list of all your websites (the Sites page). Under it, your websites by name.
The sidebar
The sidebar has up to four groups. What you see depends on your role, your plan and the edition of Replora you use.
Websites
| Item | What it’s for |
|---|---|
| Websites (the heading) | Opens the Sites page: every website of your account with its status, the date of its last data and its number of recordings, plus your usage against your plan. See Add a website. |
| A website’s name | Opens that website’s session recordings. The small arrow next to it shows or hides its pages; Replora remembers your choice in this browser, and always opens the website you are looking at. |
| All sites (n) | Shown when you have more than ten websites: opens the full list. |
Each website’s pages, in the order the sidebar lists them:
| Page | What it shows |
|---|---|
| Session recordings | Every visit, with filters, search and replays. See Session recordings. |
| Heatmaps | Clicks, scrolling and mouse movement on each page. See Heatmaps. |
| Insights | Patterns Replora found in your sessions. See Behavior insights. |
| Ask AI | Ask questions about your visitors in plain words. See Ask AI. |
| Live | Who is on the website right now. See Live visitors. |
| Surveys | Questions shown to visitors. See Surveys. |
| A/B tests | Experiments with two or more versions of a page. See A/B tests. |
| Events | Custom events your site reports. See Custom events. |
| Errors | JavaScript errors visitors hit. See JavaScript errors. |
| Forms | How visitors fill in your forms. See Form analytics. |
| Funnels | Step-by-step conversion. See Funnels. |
| Alerts | Messages when something goes wrong. See Alerts. |
| Install | The tracking code and how to install it. See Install the tracking code. |
| Settings | The website’s settings. See Website settings. |
Missing a page?
Pages your plan doesn’t include are hidden, both in the sidebar and in the buttons above the recordings list. If a page you expect (say Heatmaps or Ask AI) is missing, check Plan & billing or ask the person who manages your account.
Account
| Item | Who sees it | What it’s for |
|---|---|---|
| Settings | Everyone | Your profile, password, two-factor sign-in, language and time zone. See Account settings. |
| Team | Everyone | The people in your account and their roles. See Team & roles. |
| Plan & billing | SaaS edition | Your plan, its limits and your payments. See Plan & billing. |
| Support | SaaS edition, when turned on | Your support tickets. See Support & help. |
| Affiliate program | SaaS edition, when turned on | Your referral link and earnings. |
| Help | Everyone | The help center: articles and answers. See Support & help. |
Developers and Administration
Developers › API tokens creates keys for other tools and AI apps to read your data (see API tokens). People who administer the whole Replora installation also see an Administration group (Overview, Users, System, Translations and more); those pages are described in the Replora Docs.
At the bottom, Collapse shrinks the sidebar to icons. On a phone or a narrow window the sidebar becomes a drawer: open it with the menu button at the top left.
The website section links
On a website’s Session recordings page, a row of buttons under the title leads to the website’s other pages: Live, then the pages your plan includes (Alerts, Errors, Events, A/B tests, Forms, Funnels, Heatmaps, Insights, Ask AI, Surveys), then Install and Site settings. They are the same pages as in the sidebar, one click away while you look at recordings.
The top bar
| Part | What it does |
|---|---|
| Breadcrumbs | Where you are, e.g. Workspace › Sites › Demo Plant Shop › Settings. Click a step to go back to it. |
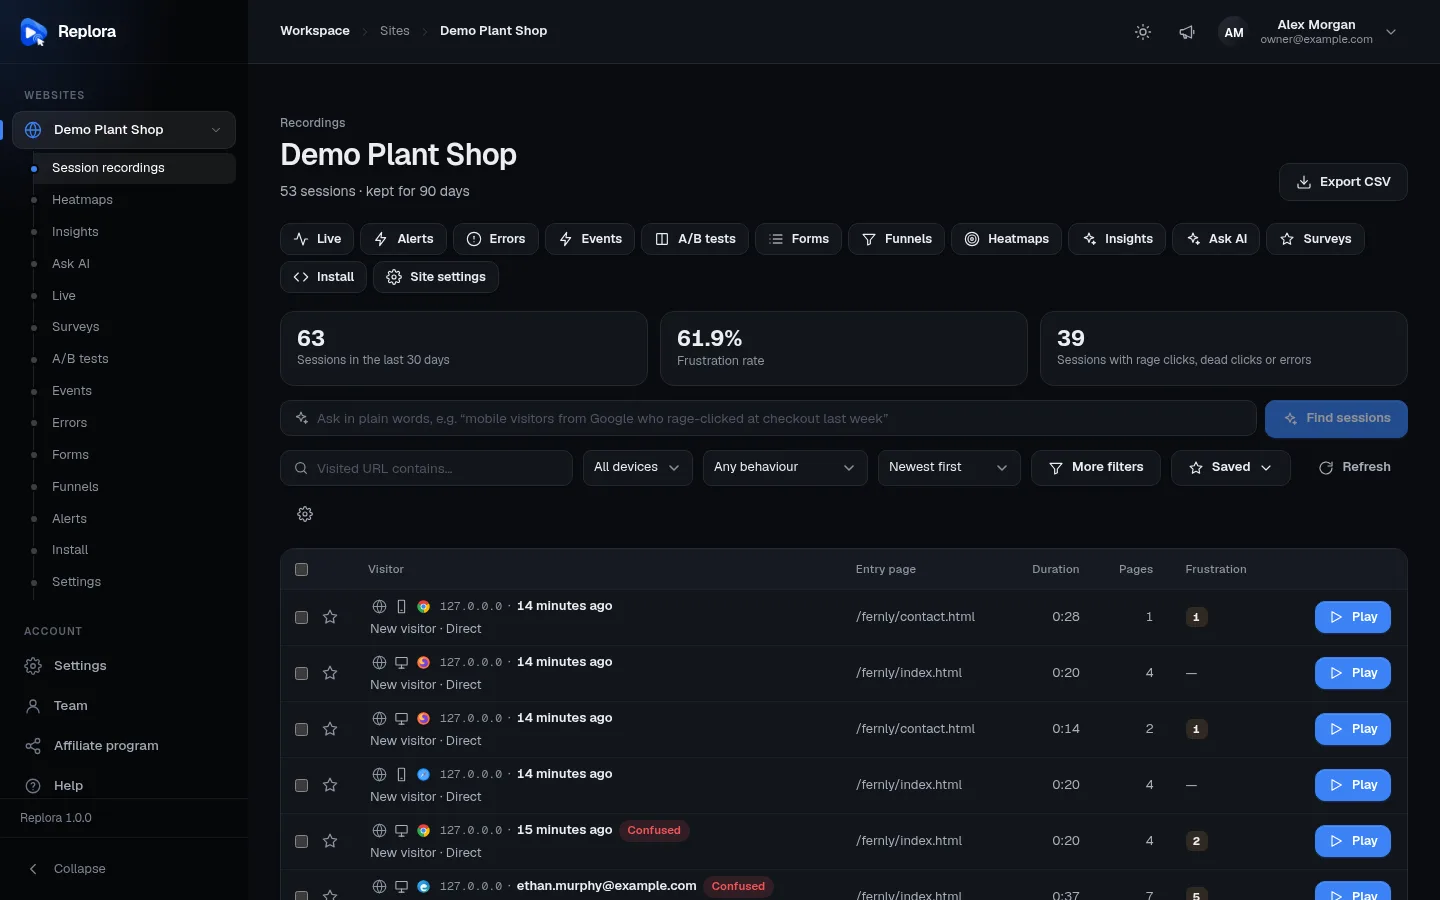
| Moon / sun | Switches the dashboard between dark and light. |
| Page buttons | Some pages put their main actions here. On a replay: Star, Share, Download and Delete. |
| Try live demo | Only when the installation has a public demo: opens it in a new tab. |
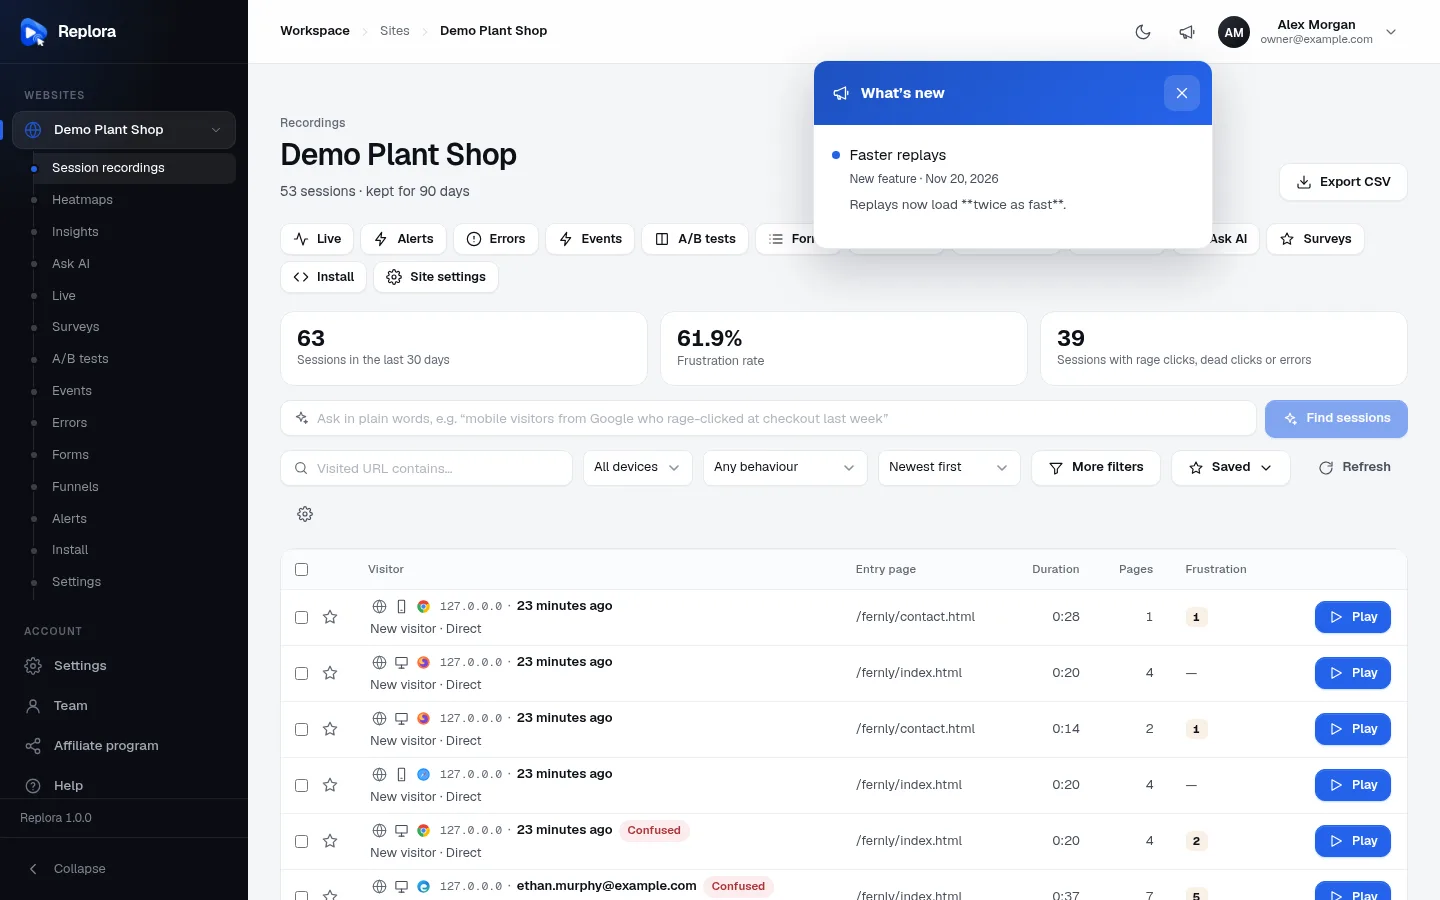
| Megaphone (What’s new) | Opens the latest announcements: new features, changes and news from the people who run your Replora. A badge counts unread ones; opening the panel marks them read. Scroll down for older ones. Close it with Esc or a click outside. |
| Account menu | Your initials, name and email. Opens Appearance, Settings and Sign out. |
Appearance
The account menu starts with Appearance:
| Option | What it does |
|---|---|
| Light / Dark / System | The colour mode. System follows your computer or phone. Your choice is remembered in this browser. |
| Accent colour | Blue, Orange, Indigo, Emerald, Violet, Rose or Slate: the colour of buttons, links and highlights. Only shown if the installation allows it. |
Language
The dashboard is available in 13 languages: English, Español, Français, Deutsch, Português, Italiano, Русский, 简体中文, 日本語, 한국어, Türkçe, Bahasa Indonesia and العربية (Arabic, right to left). Choose yours in Settings (the language menu at the top of your account settings). The choice is saved on your account, so it follows you to every device, and emails from Replora use it too. Before you sign in, the sign-in page has its own language menu.
Read-only access
If your role is Viewer, a notice at the top of each page says You have view-only access: you can look, but not change anything. Buttons that change things (Star, Share, Delete, saving settings…) are hidden or disabled. Ask a manager of the account for more rights.
Related
- Welcome: the words used everywhere in the dashboard
- Add a website
- Session recordings
- Account settings