
Appearance
Behavior insights
Behavior insights does the first round of analysis for you. It counts how many visits ran into trouble (rage clicks, dead clicks, JavaScript errors), lists the pages and elements responsible, worst first, and shows the paths visitors take through your website. Each finding has a button to watch the visits behind it.
Where to find it: in the sidebar, under your website, click Insights (for example Demo Plant Shop › Insights).
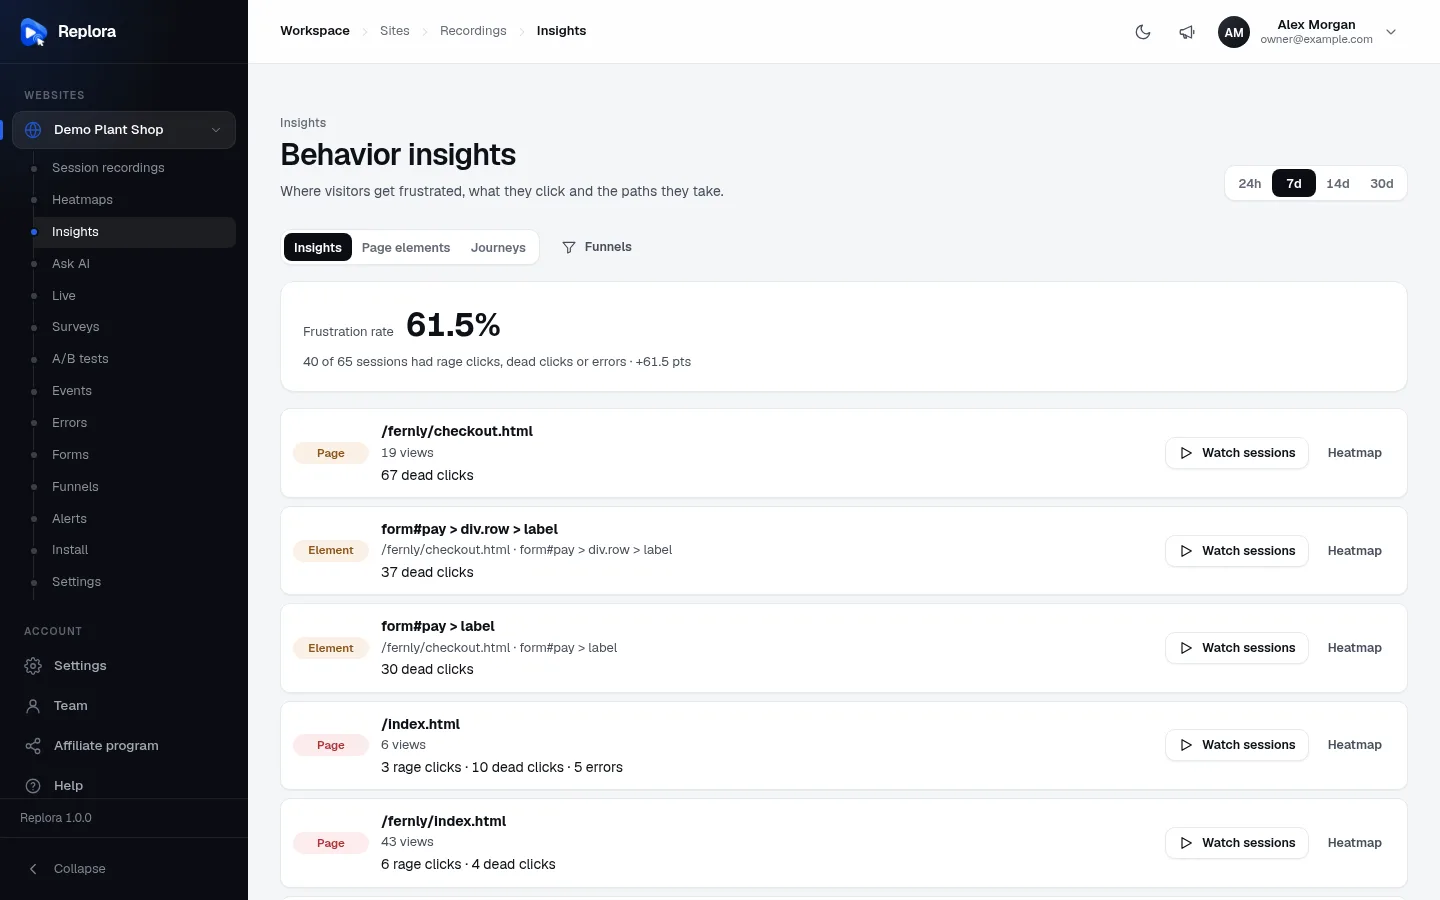
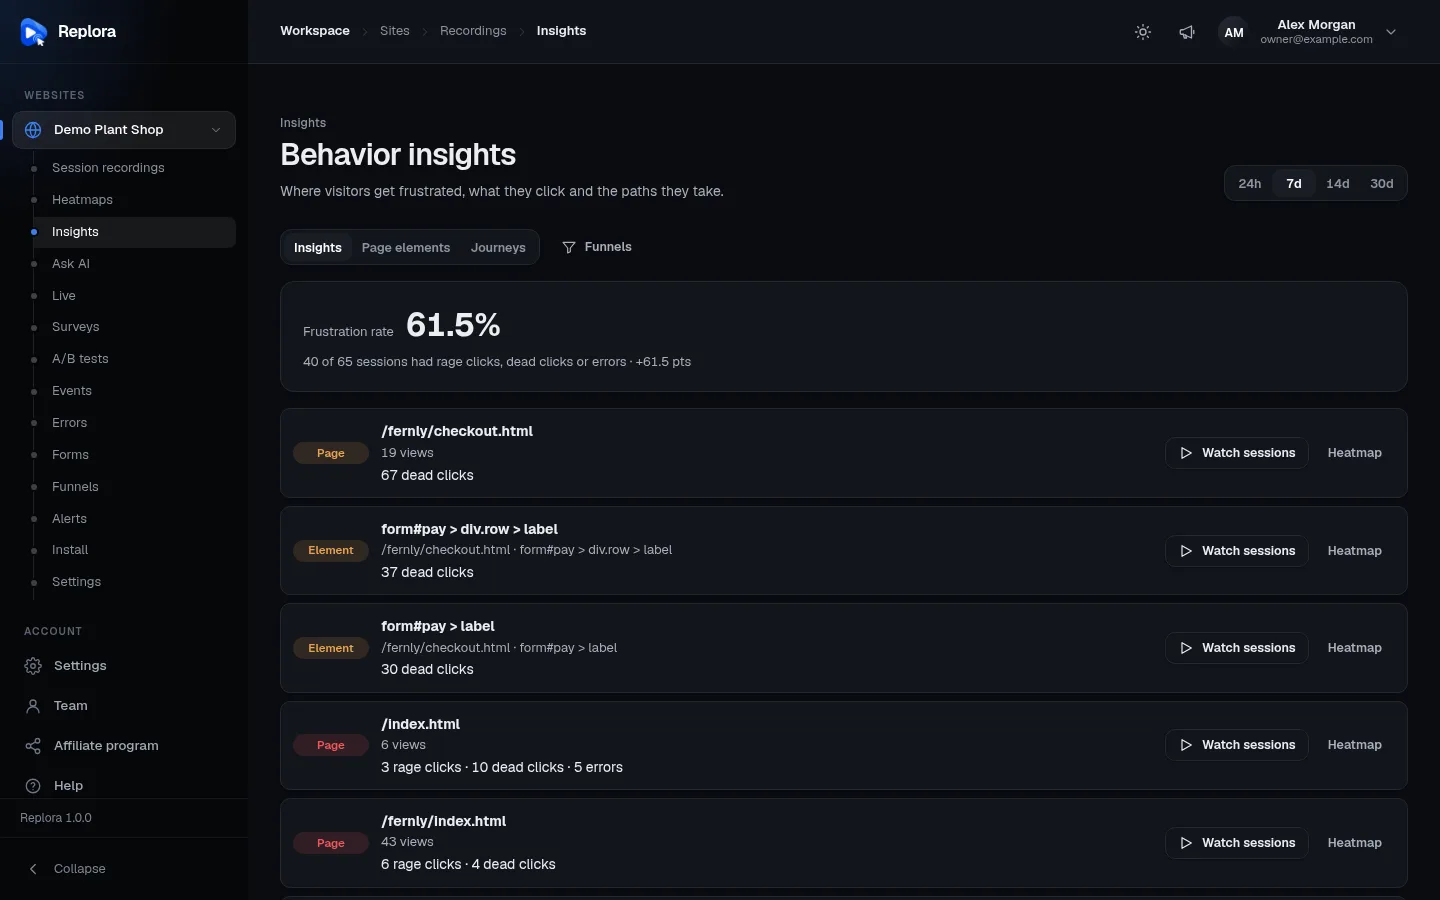
The controls at the top
| Control | What it does |
|---|---|
| 24h / 7d / 14d / 30d (top right) | The period: the last 24 hours, 7 days (the default), 14 days or 30 days. Applies to all three tabs. |
| Insights / Page elements / Journeys | The three views of this page, described below. |
| Funnels | Opens the Funnels page. Shown when your plan includes funnels. |
The tab and period are kept in the page address, so you can bookmark or share a view.
Insights tab
Frustration rate
The card at the top shows the share of sessions in the period that had at least one rage click, dead click or JavaScript error, for example 61.5%. Under it:
- “f of n sessions had rage clicks, dead clicks or errors”;
- the change against the period just before, in percentage points (“+3.2 pts”, “−1 pts” or “no change”).
| Signal | Meaning |
|---|---|
| Rage click | The third click within one second in about the same spot: something doesn’t respond, or responds too slowly. |
| Dead click | A click on something that looks clickable, after which nothing on the page changes for a second. |
| Error | A JavaScript error in the visitor’s browser. See JavaScript errors. |
The issues list
Below the rate, the pages and elements with frustration signals, worst first (rage clicks weigh more than dead clicks and errors). Up to 50 pages and 50 elements are listed, ten at a time with a pager.
| Part | What it shows |
|---|---|
| Page / Element badge | Whether the issue is a whole page or one element on a page. Red when there were rage clicks, amber otherwise. |
| Title | For a page: its path (for example /checkout). For an element: its text, or how Replora finds it on the page when it has no text. |
| Small print | For a page: “n views”. For an element: the page it is on and how Replora finds it. |
| Counts | “n rage clicks · n dead clicks” and, for pages, “n errors”. |
| Watch sessions | Opens the session list filtered to sessions that visited this page and had rage clicks, ready to replay. |
| Heatmap | Opens the page’s heatmap. Shown when your plan includes heatmaps. |
If nothing is found, you see No issues found: “No frustration signals in this period: visitors are having a smooth experience.”
Page elements tab
Every clicked element of one page, with its frustration signals.
- Choose a page in Choose a page…. The list holds the 50 most viewed pages of the period, each with its number of views.
- The table lists the page’s elements by clicks (up to 100), a page at a time.
| Column | Meaning |
|---|---|
| Element | The element’s text, or “(no text)”, and in small print how Replora finds it on the page. |
| Clicks | Clicks on it in the period. |
| Share | Its part of all clicks on the page, with a bar. |
| Rage | Rage clicks on it (red), or “—”. |
| Dead | Dead clicks on it (amber), or “—”. |
“No clicks on this page in this period.” means the page was viewed, but nobody clicked anything that Replora could name.
Journeys tab
How visitors move through your site, from the page they land on. Journeys need visits of two pages or more; until there are some you see No journeys yet.
Explore journeys
Pick a path one step at a time.
- The first column, Landing page, lists the pages visits started on (up to 15), each with its number of sessions and share. The bar shows the share.
- Click a page: a new column, After that page, shows where those visitors went next.
- Keep clicking to follow the path further. Clicking a page in an earlier column replaces the columns after it.
Each column after the first also shows Left the site: n (rate%), the visitors who stopped there. It is highlighted when half or more left. Journeys are followed for their first five pages; after that the column says “Journeys are followed for their first five pages.”
Where visitors go
A map of how visits branch, from All visits on the left through the landing pages to the next pages, four steps deep. Thicker lines carry more visitors. Hover a page to read how many sessions reached it that way and their share of the step before; click a page to watch its sessions (the session list opens filtered to visits of that page). Landing pages with very few visits are left out, with a note saying how many.
Suggested funnels
Common paths worth measuring step by step: paths of three pages or more taken by at least two sessions (up to three suggestions). Create funnel turns a path into a funnel at once, one step per page, and opens the Funnels page. Shown when your plan includes funnels.
Most common journeys
The 20 most frequent page paths of the period (two pages or more), with how many sessions took each. Click a page to watch the sessions that visited it.
Tips
- Start with the top issue. Click Watch sessions and watch three or four visits: you usually see the problem within minutes.
- Dead clicks on images or text often mean visitors expect a link there. Either add one or make the element look less clickable.
- Compare periods. A jump in the frustration rate right after a release is a good reason to check JavaScript errors.
- Get told automatically. Set up an alert for rage clicks or errors so you don’t have to check this page every day.
Who can use it
Everyone with access to the website, including viewers. In the SaaS edition behavior insights must be included in your plan.
Related
- Heatmaps
- Funnels
- JavaScript errors
- Ask AI: ask “Where do visitors get frustrated the most this week?” in plain words.
- Filters & search